Swimming Pools Are a Highly Prized Amenity Amid the Summer Heat
Swimming pools are a rare commodity in New York City. Public city pools can have hours long lines, while some private pools charge nearly $150 for a day pass. As the summer heat peaks, a cool dip in a swimming pool can be a welcome treat. Other cities in the U.S. have it better, but which has it best?
A new LendingTree study ranks the 50 largest cities by its share of homes with a swimming pool. We found that about 10% of homes have pools, ranging from nearly 33% in Phoenix to 1% in Portland, Ore. We also looked at the values of homes with and without swimming pools to show how much this amenity is worth. Let’s dive in.
Key findings
- You’ve gotta pay to play: The median home with a pool is valued at $469,187, while the median home without a pool is valued at $305,152 — a 54% premium. The highest premium is in Memphis at a whopping 157%.
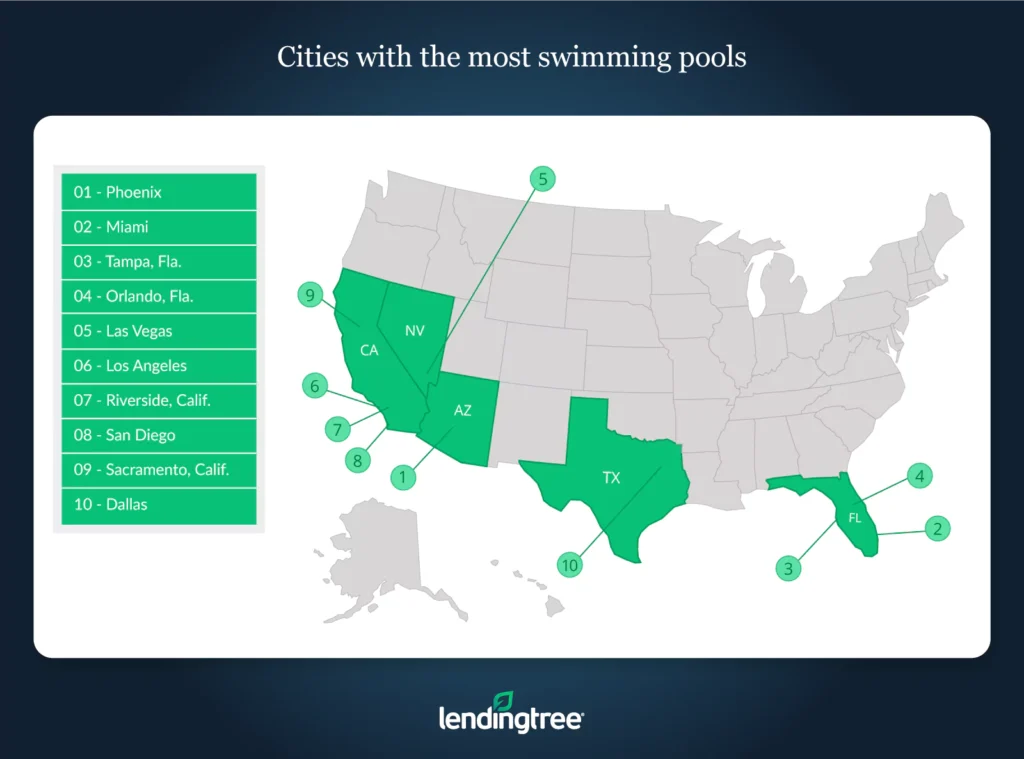
- Go West: It’s no surprise that six of the top 10 cities for swimming pools are in the West — four in California and one each in Arizona and Nevada.
- Hot, hot, hot: Phoenix, which experiences more than 100 days above 100 degrees a year, leads the way with 32.7% of homes having a swimming pool.
- Sunshine State: Florida is not far behind California with three cities in the top 10. Miami, Tampa and Orlando rank second, third and fourth, respectively.
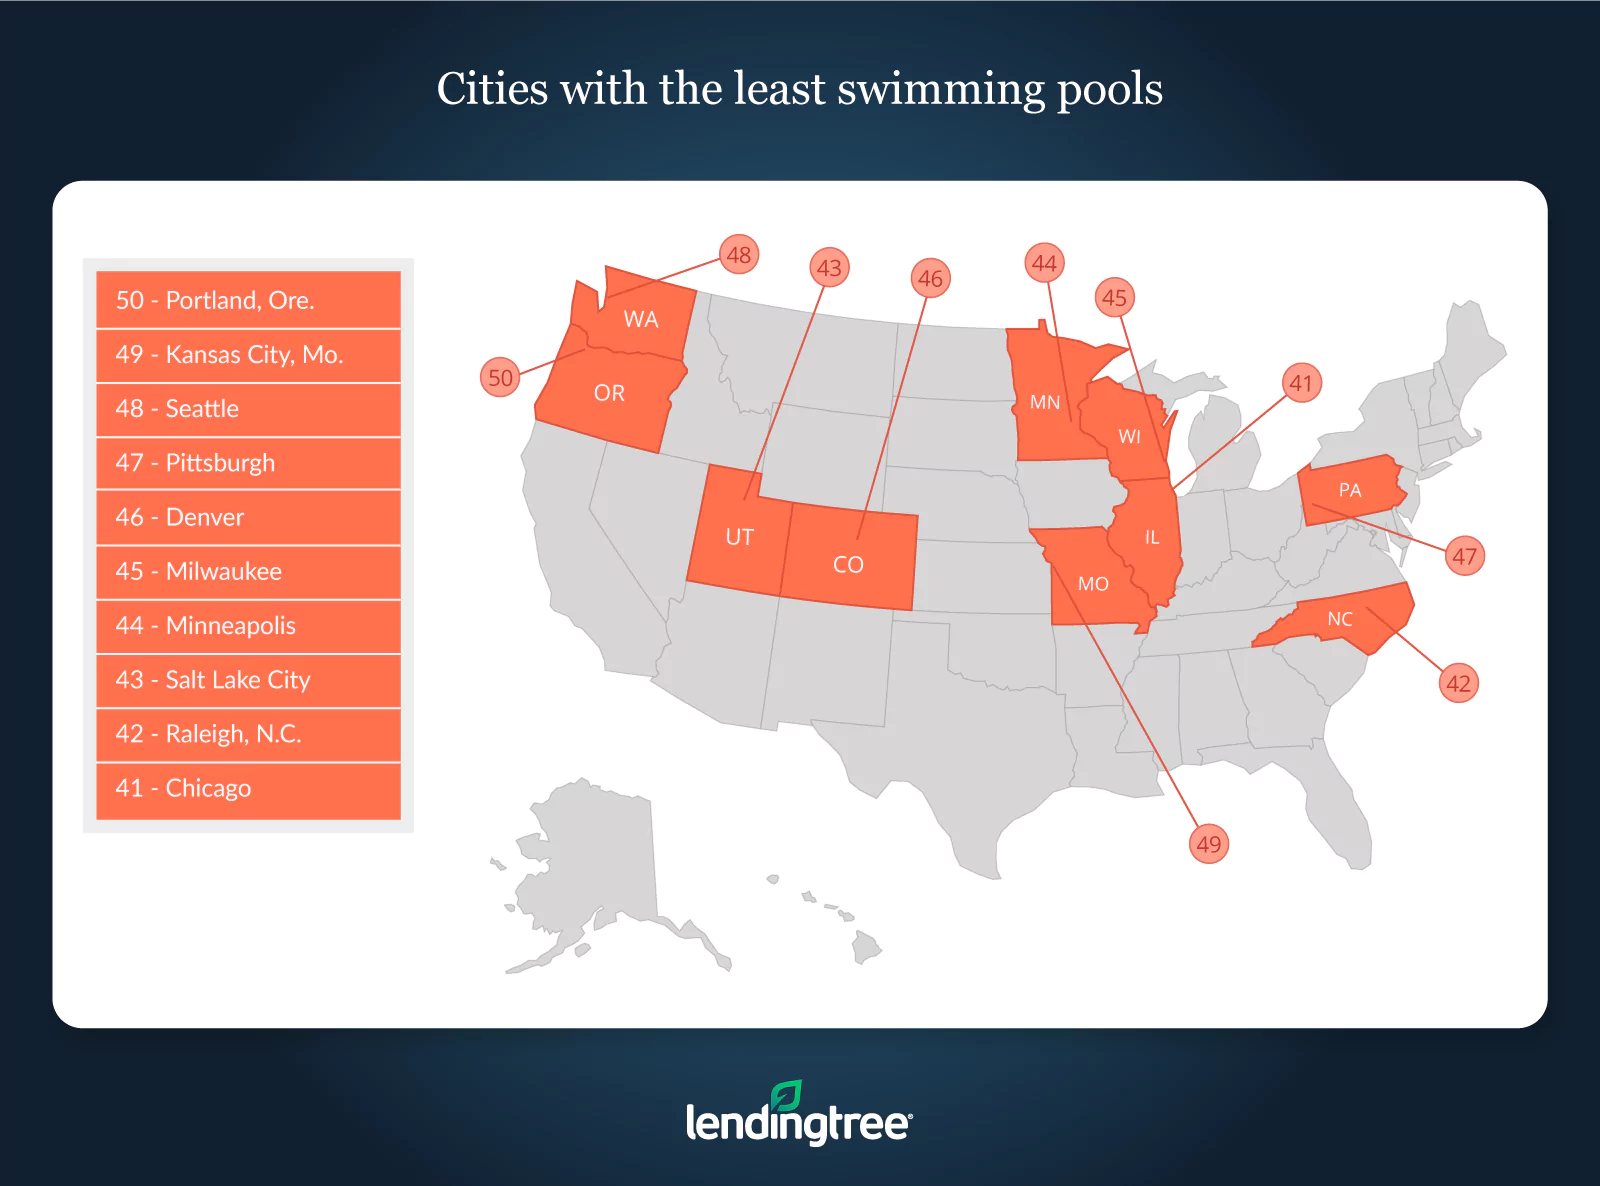
- Rain and water don’t mix: Two of the cities with the least swimming pools are in the rainy Northwest. Portland is in last place with just 1% of homes with pools, while Seattle is not far ahead with 1.3%.
Cities with most swimming pools
No. 1: Phoenix
- Share of homes with pools: 32.7%
- Size of homes with pools vs. without pools (square feet): 2,258 vs. 1,647
- Value of homes with pools vs. without: $355,000 vs. $224,000
- Price per square foot of homes with pools vs. without: $157 vs. $136
No. 2: Miami
- Share of homes with pools: 30.6%
- Size of homes with pools vs. without (square feet): 2,316 vs. 1,524
- Value of homes with pools vs. without: $459,000 vs. $282,000
- Price per square foot of homes with pools vs. without: $198 vs. $185
No. 3: Tampa, Fla.
- Share of homes with pools: 27.7%
- Size of homes with pools vs. without (square feet): 2,018 vs. 1,400
- Value of homes with pools vs. without: $296,000 vs. $180,000
- Price per square foot of homes with pools vs. without: $147 vs. $129

Cities with least swimming pools
No. 1: Portland, Ore.
- Share of homes with pools: 1%
- Size of homes with pools vs. without pools (square feet): 2,151 vs. 1,600
- Value of homes with pools vs. without: $574,000 vs. $385,000
- Price per square foot of homes with pools vs. without: $267 vs. $241
No. 2: Kansas City, Mo.
- Share of homes with pools: 1.2%
- Size of homes with pools vs. without (square feet): 2,492 vs. 1,423
- Value of homes with pools vs. without: $346,000 vs. $170,000
- Price per square foot of homes with pools vs. without: $139 vs. $119
No. 3: Seattle
- Share of homes with pools: 1.3%
- Size of homes with pools vs. without (square feet): 2,230 vs. 1,640
- Value of homes with pools vs. without: $744,000 vs. $470,000
- Price per square foot of homes with pools vs. without: $334 vs. $287

50 largest cities ranked by share of homes with swimming pools
Methodology
To determine the cities with the highest share of homes with swimming pools, we looked at data pulled in August 2019 from LendingTree’s database of U.S. residential properties. The database includes estimated home values for more than 155 million properties in the U.S. based on public tax, deed, mortgage and foreclosure data, as well as proprietary local data used to power home financing recommendations for LendingTree users. Our definition of cities is from the Census Bureau’s core-based statistical area (CBSA) boundaries.
View mortgage loan offers from up to 5 lenders in minutes